
ABSTRACT
The APR-E valve is the electronically commanded version of the mechanical APR Control, a mechanical modulating external compressor unloader that provides continuous capacity modulation on direct-expansion (DX) refrigeration circuits. The APR-E is piped into the circuit identically to the mechanical valve, but it does not respond to suction pressure; its position is set entirely by an external controller. Two controller architectures are offered: a standalone controller that modulates the valve on deviation from a fixed setpoint, and a control board that accepts a 0-10 VDC or 4-20 mA command from a building automation system (BAS), allowing an HVAC programmer to modulate circuit capacity for whatever objective the application requires.
This paper presents evidence for the APR-E across both architectures, drawn from three independent sources that are analyzed separately and never numerically combined. First, a field comparison at a multi-tenant medical office building: two identical nominal 150-ton packaged rooftop units serving the same building, one retrofitted with a 20-ton APR-E on its lead circuit under the standalone controller, the other left unmodified as a control. Measured over matched pre- and post-installation windows, compressor stage cycling on the APR-E unit collapsed from a mean of 11.0 stage transitions per day to 1.0 (median zero), while the untreated twin’s weather-driven change over the same calendar was far smaller. Second, a controlled-environment agriculture facility in which a BAS commands the APR-E through the 0-10 VDC board to hold vapor pressure deficit (VPD): logged data show the facility resetting temperature and humidity setpoints across a lights-on transition such that the implied VPD target stays essentially constant, and the zone tracking that moving target. Third, the published ASHRAE research project RP-1604, in which an APR-E under a tuned BMS algorithm held discharge air within ±1°F of setpoint on a single-stage compressor in a cleanroom test laboratory. Together the three sources span the product’s intended range: from a non-tunable drop-in controller that quiets staging on a large rooftop unit, to fully engineered precision control. Every result in this paper is labeled as measured, derived, inference, field experience, reported attestation, or published source.
1. INTRODUCTION
Most direct-expansion cooling equipment modulates capacity in coarse steps: compressors stage on and off, and between stages the equipment either overshoots or cycles. Suction-gas-modulation methods, which divert compressor discharge gas through a desuperheating path back to the suction side, are an established approach to continuous capacity modulation at part load, and the published literature documents their use for stabilizing evaporating conditions in DX systems [1]. The mechanical APR Control is a self-regulating implementation of this principle: it senses suction pressure directly and modulates on its own, with no external controls. Its behavior on instrumented laboratory circuits is documented in companion papers by this author; those findings attach to the mechanical, suction-pressure-regulated valve and are not restated here as claims about the APR-E.
The APR-E is the electronically commanded member of the same product family. It shares the mechanical valve’s diversion hardware and is piped into the refrigeration circuit in exactly the same way, but the control philosophy is inverted: the APR-E does not respond to suction pressure at all. Valve position is set by an external controller, which means the modulation objective is whatever the controller is told to pursue. In practice the most common objective is precise discharge air temperature (DAT) control, but the 0-10 VDC / 4-20 mA interface makes the objective programmable: humidity, VPD, coil temperature limits, or any other variable a BAS can compute.
This paper documents the APR-E’s field behavior under both of its controller architectures. Section 3 describes the hardware and the two controllers. Section 4 presents a twin-unit field comparison on 150-ton rooftop equipment under the standalone controller. Section 5 presents VPD-tracking data from a controlled-environment agriculture facility under BAS 0-10 VDC command. Section 6 summarizes the published ASHRAE RP-1604 cleanroom application. Section 7 reports an additional application known to the author only through field consultation. Section 8 discusses what the combined record does and does not establish.
2. EVIDENCE BASE, ATTRIBUTION, AND LABELING CONVENTIONS
Three evidence sources are used and kept strictly separate; no numeric result is transferred or averaged across them. (1) A raw building-automation data export covering two rooftop units at a medical office building, May 1 through July 31, 2025, at 15-minute intervals. (2) Facility trend logs and a control-system data export from a controlled-environment agriculture facility, 2026. (3) The published Rawal Devices case study of ASHRAE Research Project RP-1604 [2] and the associated ASHRAE project listing [3]. The two field facilities are anonymized. All datasets were profiled programmatically over every logged row; no result in this paper rests on visual inspection of a trend screenshot except where explicitly identified as a facility-provided trend observation.
Every quantitative statement is labeled. “Measured” means computed directly from logged data. “Derived” means computed by the author from logged data through a stated formula (for example, VPD from logged temperature and humidity). “Inference” means an interpretation consistent with the data but not provable from it. “Field experience” means the author’s or the manufacturer’s direct application experience. “Reported attestation” means a statement made to the author by a third party and reported as such. “Published source” means a claim taken from the cited literature. Findings about the mechanical APR Control from companion papers are never generalized to the APR-E, and vice versa, without an explicit statement.
3. THE APR-E AND ITS TWO CONTROLLER ARCHITECTURES
3.1 Hardware and Piping
The APR-E is an electrically driven, electronically controlled external compressor unloading device [2]. It installs on the refrigeration circuit with the same piping arrangement as the mechanical APR Control (connections to the discharge, suction, and liquid lines): a gas-diversion path with a desuperheating chamber returning cool gas to the suction side. The essential functional difference is the absence of any internal suction-pressure regulation. A mechanical APR opens on falling suction pressure; the APR-E opens when, and only as far as, its controller commands. The valve therefore has no behavior of its own; the controller architecture defines the application.
3.2 The Standalone Controller
The standalone controller modulates the APR-E on deviation from a fixed setpoint, typically a discharge air temperature. It is not tunable, and it is less accurate than a fully programmed control loop; the effective control point can drift by as much as 3-4°F from the nominal setting (field experience). It is intended for non-critical applications where the objective is load matching and cycling relief rather than tight temperature tolerance, and where no BAS integration is desired. Section 4 documents exactly this use.
3.3 The 0-10 VDC / 4-20 mA Control Board
The control board accepts an analog command signal and positions the valve accordingly, placing the modulation objective entirely in the hands of the HVAC programmer. The most common implementation is precise discharge air control; the author has observed deviations as small as 0.1°F from a DAT setpoint under varying coil loads in programmed installations (field experience). Sections 5 and 6 document two programmed applications with different objectives: constant VPD in an agriculture facility, and tight-tolerance discharge air in a cleanroom research laboratory.
4. FIELD STUDY 1: TWIN 150-TON ROOFTOP UNITS UNDER THE STANDALONE CONTROLLER
4.1 Site, Equipment, and Installation
A multi-tenant medical office building is served by, among other equipment, two identical nominal 150-ton packaged rooftop units of the same manufacturer and model line, each with two refrigeration circuits and four compressors. In mid-June 2025 one unit, designated Unit B here, was retrofitted with a single APR-E rated for 20 tons of capacity modulation, installed on the first (lead) circuit only, under the standalone controller. The second unit, Unit A, was left unmodified and serves as an untreated control operating in the same building over the same period. The controls contractor reports the valve was installed June 14-15, 2025 (reported attestation); the building data export independently corroborates this: Unit B’s controller communication was down for 72% of the samples on exactly those two days and essentially never otherwise (measured).
4.2 Control Architecture: Two Independent Loops
Two control loops operate on Unit B’s lead circuit, and understanding the result requires keeping them distinct. The rooftop unit’s native controller stages compressors against its own discharge air setpoint; that setpoint is present in the logged data and sat at 55°F for most of the record (measured). The standalone APR-E controller modulates the valve against its own, separate setpoint. That setpoint controls only the valve, plays no part in compressor staging, and was not trended. It is assumed to have been set at 55°F, consistent with typical practice for this equipment, but the standalone controller’s drift means the effective control point may sit several degrees from nominal (assumption and field experience; not logged data).
The mechanism this architecture makes available is straightforward: load swings that previously drove the discharge air across the unit controller’s stage-up and stage-down thresholds can instead be absorbed by valve modulation on the lead circuit. The two setpoints do not need to match precisely for this to work; the valve only needs to hold discharge air inside the unit’s staging deadband. That robustness to imprecise setup is the property under test in this section.
4.3 Data Set, Analysis Windows, and Exclusions
The export covers both units from May 1 through July 31, 2025 at 15-minute intervals: 8,832 rows per unit with no gaps by row count (measured). Both units are scheduled occupied essentially continuously. Four windows are defined. The pre-installation baseline (PRE) runs May 1 through June 13, with both units unmodified. June 14-15 are excluded as installation days. The post-installation comparison window (POST) runs June 16 through July 10. July 11-31 is excluded for Unit B: on July 11 a building-automation scheduling fault began driving Unit B into unoccupied cooling transitions overnight, with the unit’s DAT setpoint bouncing between its cooling and heating values (reported attestation from the controls contractor). The logged data confirm the onset independently: occupancy-state flapping and heating output appear on Unit B beginning July 11-12 and continue through the end of the export (measured). The contractor reports the fault was subsequently corrected; the post-correction period lies outside this paper’s data window. All rows flagged as controller communication loss are excluded from every statistic.
One further pre-window observation is disclosed: Unit B shows morning heating activity on May 1-8 that Unit A largely does not, cause unknown. A sensitivity check excluding those eight days changes Unit B’s pre-installation cycling statistic from 11.0 to 9.9 stage transitions per day and does not affect any conclusion (measured).
4.4 What This Export Can and Cannot Support
A programmatic channel audit found that several columns present in the export header were never populated for either unit: unit and fan power (kW), supply airflow, refrigerant pressures in psi, cumulative compressor start and run-time counters, expansion-valve position, refrigerant mass flow, and cooling-coil leaving air temperature; the mixed-air channel reads a constant zero (measured). Consequently this paper makes no energy, power, or direct compressor-start-count claims from this site. In addition, the per-circuit “saturated suction temperature” channels are numerically identical to the suction line temperature channels, with computed superheat pegged at zero throughout. These are temperature-sensor readings mislabeled as saturation values, and they are used only qualitatively (measured). The channels that are reliably populated, and on which Section 4.5 rests, are: supply air temperature and its active setpoint, cooling output percentage, outdoor air temperature, occupancy state, and operating mode.
The cooling output channel is quantized at 0 / 25 / 50 / 75 / 100 percent, corresponding to the four compressor stages (measured). The count of stage transitions per day is therefore used as the compressor cycling metric. Because 15-minute sampling cannot register cycles shorter than the sampling interval, pre-installation transition counts are lower bounds, which makes the reductions reported below conservative.
4.5 Result: Stage Cycling Collapse on the APR-E Unit
Table 1 summarizes stage cycling in the two windows. On Unit B, mean stage transitions fell from 11.0 per day before installation to 1.0 per day after, and the median post-installation day has zero stage changes. The share of samples with all compressors off fell from 24.4% to 0.2%, and the unit’s dominant operating state shifted from the 25% stage to the 50% stage, held continuously while the valve trims within it. Unit A, the untreated twin, also cycled less in the post window, 35.1 down to 15.3 transitions per day, but that change tracks the season: mean outdoor temperature rose from 65.6°F in the pre window to 80.5°F in the post window, and steadier high loads cycle any staged unit less (all measured).
| Metric (measured) | Unit B (APR-E) PRE → POST | Unit A (untreated) PRE → POST | Note |
|---|---|---|---|
| Stage transitions per day, mean | 11.0 → 1.0 | 35.1 → 15.3 | Unit B median POST = 0 |
| Stage transitions per day, 65-75°F OAT bin | 9.6 → 2.3 (−76%) | 32.6 → 19.7 (−40%) | Weather-matched comparison |
| Share of samples at zero cooling output | 24.4% → 0.2% | 42.9% → 13.2% | |
| Dominant cooling stage | 25% → 50% (held) | 25% → 25% | Unit B holds one stage; valve trims within it |
Table 1. Compressor stage cycling before and after APR-E installation, with the identical untreated twin as control. PRE = May 1-June 13, 2025; POST = June 16-July 10, 2025. All values measured from the 15-minute building-automation export; transition counts are lower bounds due to sampling interval.
To control for the warmer post window directly, the transition statistic was recomputed within matched outdoor-temperature bins. In the 65-75°F bin, present in both windows, Unit B’s cycling fell 76% while Unit A’s fell 40% (measured). The untreated twin quantifies how much cycling relief the season alone provides; Unit B’s reduction is roughly double the seasonal effect and terminates in essentially cycle-free operation. Residual confounding within outdoor-temperature bins (humidity, solar, and internal loads) cannot be excluded from a two-unit field record and is acknowledged.
4.6 Discharge Air Temperature: Observations Without Attribution
Because the standalone controller’s actual setpoint was never logged and its drift specification is several degrees, this paper deliberately makes no discharge-air-precision claim for this site. For completeness: during active cooling, Unit B’s supply air temperature ran on the order of 1-2°F below the rooftop unit’s 55°F setpoint in the post window, and its short-term variability was low (measured). An interpretation consistent with the two-loop architecture is that the valve held discharge air near the standalone controller’s own effective control point, slightly below the unit setpoint, leaving the staging logic satisfied; but since the controller’s actual setting is unknown, this is stated as inference, not finding. Discharge-air precision claims for the APR-E are made only in Sections 5 and 6, where the commanding controller and its target are documented.
4.7 Disclosures
Three limitations are stated plainly. First, the two units are hardware twins but were not operational twins at baseline: Unit A cycled roughly three times as much as Unit B before the installation, presumably reflecting different zone loads. The comparison therefore relies on each unit’s change relative to its own baseline, not on the units matching each other. Second, both units run supply air 1-2°F below the logged unit setpoint on average, before and after; this offset predates the APR-E and is not attributed to it. Third, the July 11-31 exclusion removes a period in which the APR-E unit was the one misbehaving; the fault was a building-automation scheduling defect unrelated to the valve (reported attestation, with the onset independently visible in the data), and the planned post-correction export will document normal operation after the fix.
5. FIELD STUDY 2: VPD CONTROL AT A CONTROLLED-ENVIRONMENT AGRICULTURE FACILITY
5.1 Application and Control Strategy
An indoor controlled-environment agriculture facility uses APR-E valves under the 0-10 VDC control board, commanded by the facility’s automation system. The control objective is not a fixed temperature: the facility controls its flowering rooms to vapor pressure deficit (VPD), the humidity metric that governs plant transpiration. Because VPD is a joint function of temperature and relative humidity, holding it constant across a lighting transition requires the temperature and humidity setpoints to move together, and requires cooling equipment that can track moving setpoints smoothly. This is precisely the programmable-objective use of the 0-10 VDC architecture described in Section 3.3.
5.2 The Constant-VPD Setpoint Signature
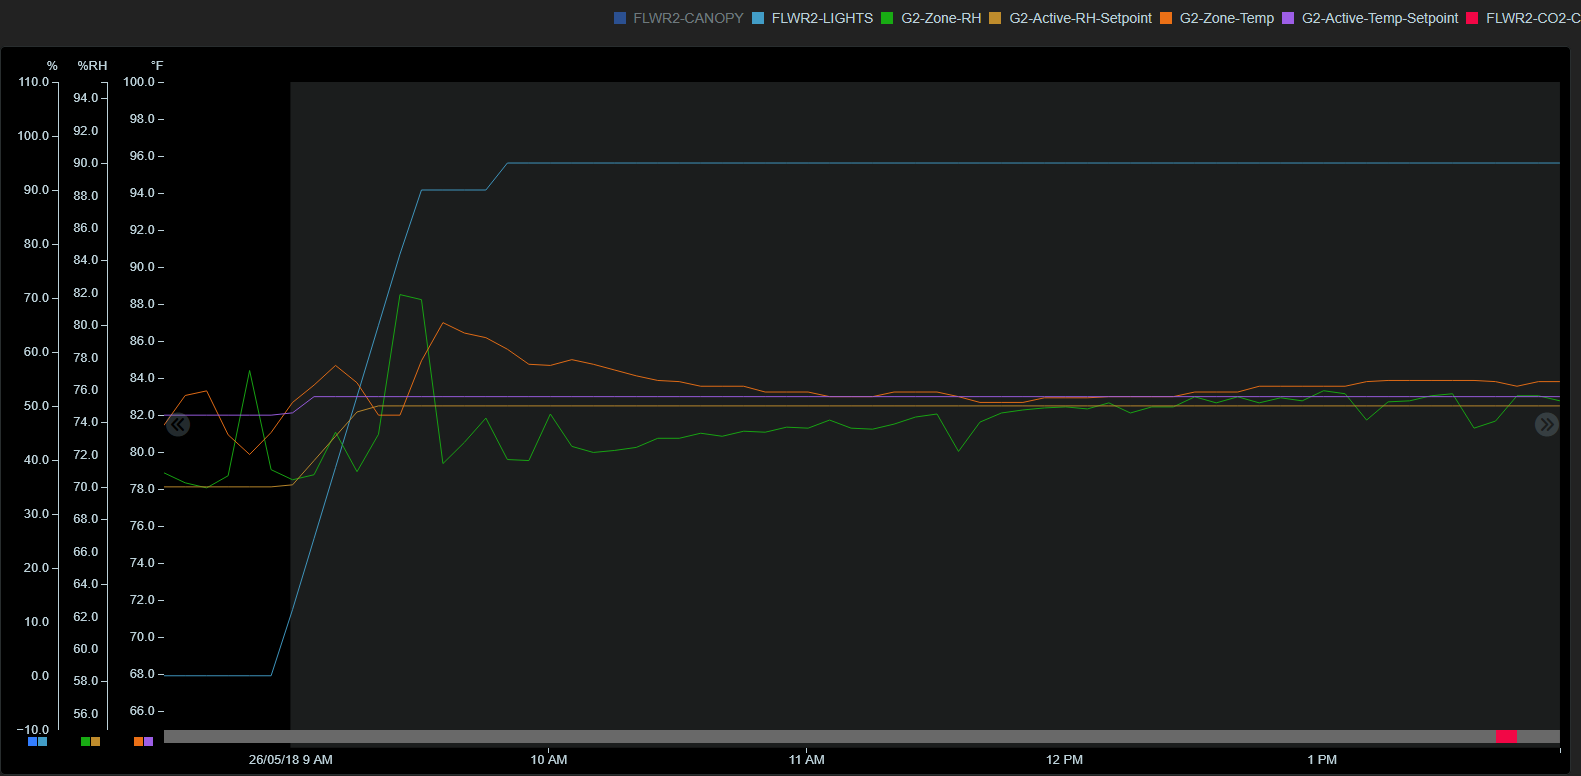
A one-day control-system export from a flowering room (May 29, 2026, 04:05-20:00, 5-minute intervals, 192 rows, no gaps) logs zone temperature and humidity, their active setpoints, and lighting output (measured). Between 09:00 and 09:30, as the lights ramp from roughly 12% to 100%, the active setpoints step from 76°F / 70% RH (dark period) to 82°F / 75% RH (light period). Computing the air VPD implied by each setpoint pair gives 0.92 kPa for the dark-period pair and 0.93 kPa for the light-period pair (derived; VPD is not itself logged in this export). The two setpoint regimes are thus nearly identical in VPD terms: the automation system is resetting temperature and humidity in concert to hold a constant VPD target of approximately 0.93 kPa across the lighting transition, and the facility’s own operator dashboard displays a VPD of 0.94, corroborating the derivation (facility-provided display value).
5.3 Tracking Performance
Table 2 reports zone tracking against the active setpoints. In the settled light period, excluding the first hour after full lighting, zone temperature held within −0.2 to +1.6°F of setpoint with a mean deviation of +0.5°F, and relative humidity held within −3.6 to +1.2% RH with a mean of −0.6% RH; the +1.6°F extreme is the momentary spike as the lights reach full output (measured). The corresponding computed VPD ranged 0.89-1.09 kPa with a mean of 0.97 kPa against the ≈0.93 kPa setpoint-implied target (derived). During the dark period, with the room at minimum load, tracking is looser: temperature within roughly ±2°F and humidity excursions to +5% RH (measured).
| Quantity | Settled light period (n = 114) | Dark period |
|---|---|---|
| Temperature deviation from active setpoint (measured) | −0.2 to +1.6°F, mean +0.5°F | −1.4 to +2.1°F |
| RH deviation from active setpoint (measured) | −3.6 to +1.2% RH, mean −0.6% RH | up to +5.3% RH |
| Computed air VPD (derived) | 0.89-1.09 kPa, mean 0.97 kPa | 0.72-1.03 kPa |
| Setpoint-implied VPD target (derived) | 0.93 kPa | 0.92 kPa |
Table 2. Zone tracking at the agriculture facility, flowering room, May 29, 2026, 5-minute logged data. “Derived” values are computed by the author from logged temperature and humidity; VPD is not logged in the export.
A facility-provided trend log from the same room on a different day (May 18, 2026) annotates temperature holding 82.5-83.5°F on an 83°F setpoint and humidity within about ±1.5% RH through the hours after lights-on (facility-provided trend observation; not independently recomputed from raw data). The May 29 export analyzed above, sampled at 5-minute resolution, shows somewhat wider excursions than that trend annotation; both are reported, and the claims of this section rest on the recomputed May 29 statistics.
A before-and-after comparison from the same room completes the picture. Facility-provided trend captures show the room operating under the same control criteria before and after the APR-E installation (the two captures carry different room labels in the facility’s software; they are the same room). The pre-installation capture shows relative humidity swinging in a sustained sawtooth of roughly 60 to 77% RH, the air-side signature of full-capacity cycling against a light latent load. The post-installation record is the control documented above: humidity within about ±1.5% RH and temperature within a degree of setpoint (facility trend observation), with the independently recomputed May 29 statistics of Table 2 consistent. The swing that disappeared is the cycling of Section 4, seen from the air side (facility-provided captures; pre-installation amplitude read from the capture’s axis, not recomputed from raw data).

5.4 Limitations
This is a single-day export from a single room, with no untreated comparison space in the same data set and no equipment-side channels logged; it documents that the control objective is achieved, not how much of the achievement to apportion between the APR-E and the rest of the facility’s systems. Facility-provided before-and-after trend screenshots exist for other rooms, but the room and date correspondence between them has not yet been confirmed and they are therefore not presented as a comparison here. A multi-day export including a comparable space would strengthen this section and is being pursued.
6. PUBLISHED APPLICATION: ASHRAE RESEARCH PROJECT RP-1604
The third leg of the record is published [2, 3]. ASHRAE Research Project RP-1604 built an automated cleanroom test laboratory in Farmington Hills, Michigan, comprising four cleanrooms spanning ISO Class 8 through Class 1, to develop cleanroom standards and verify demand-controlled-filtration energy strategies, with Wei Sun, P.E. of Engsysco, Inc. as Principal Investigator. The experimental method varies supply airflow on real-time particle counts rather than on temperature, which forces the cooling plant to vary supply air temperature continuously to hold the space condition. The donated condensing unit was a standard single-stage, non-modulating 3.5-ton unit: equipment that cannot natively perform continuous discharge-air reset.
The design team added an APR-E under their building-management system with a tuned control algorithm. As published, the discharge air temperature never varied more than 1°F from setpoint despite continuously varying airflow, and the Principal Investigator states the installation maintained deviation of no more than ±1°F across the four-cleanroom testing suite (published source [2]). Within this paper’s framework, RP-1604 documents the fully engineered end of the 0-10 VDC architecture: a single fixed compressor converted to a precision modulating discharge-air controller by valve command, on the same hardware and interface as Section 5, under a more tightly tuned program, in a far less forgiving application.
7. ADDITIONAL REPORTED APPLICATION: MINIMUM DISCHARGE AIR WITH A SUCTION-PRESSURE HIGH-LIMIT
One further application is included for completeness and labeled accordingly. Because the APR-E itself has no suction-pressure awareness, a programmed installation can pair the discharge-air sensor with a suction pressure transducer: the program drives discharge air as low as the application demands while the transducer supplies a coil-protection limit, the two signals together producing the lowest discharge air temperature the coil can deliver without freezing. Discharge air approaching the freezing point has been achieved in this arrangement. The author knows this application through direct consultation with the field technicians who implemented it, who reported being impressed with the results; no logged data from such an installation was available for this paper, and no measured claim is made (reported attestation and field experience). Instrumenting one such installation is an identified follow-up.
8. DISCUSSION
The three documented sources answer different questions, and their differences are the point. The medical office building answers the least demanding question with the most demanding evidence: given the cheapest possible deployment (a non-tunable standalone controller, setpoint never logged, on one circuit of a 150-ton machine), does the valve still deliver its core mechanical benefit? The measured answer is that compressor stage cycling essentially ceased, verified against an identical untreated twin and within weather-matched bins, with the sampling method biased against the finding. Notably, this result did not require precision: the standalone controller’s several-degree drift did not prevent the valve from absorbing the load swings that had driven staging.
The agriculture facility and RP-1604 answer the opposite question: given full BAS command through the 0-10 VDC board, how far can the objective be taken? The agriculture facility shows the objective itself becoming programmable: a constant-VPD target synthesized from two moving setpoints, tracked through a large lighting transient. RP-1604 shows the tolerance floor: ±1°F on a single-stage compressor in a cleanroom, under a tuned algorithm (published source). The author’s field experience of 0.1°F tracking in programmed installations sits at the same end of the range and is offered as experience, not as a claim of this paper’s datasets.
Two boundaries on the record are restated. No energy or power claim is made anywhere in this paper: the medical-office export logged no power channels, and neither field site instrumented consumption. And no finding from the mechanical APR Control’s laboratory record (capacity-neutrality at full load, unloading magnitudes, freeze-exposure behavior) is asserted here for the APR-E; the two products share diversion hardware but differ in the control law, and each carries its own evidence. What the mechanical valve’s record does establish, and the present record is consistent with, is the underlying principle that suction gas modulation through a desuperheating path provides smooth continuous capacity reduction on DX circuits [1].
9. CONCLUSION
The APR-E converts staged DX equipment into externally commanded modulating equipment, and the field record now documents both ends of its controller range. Under the standalone controller, untuned and with the setpoint unverified, a 20-ton valve on the lead circuit of a 150-ton rooftop unit reduced compressor stage cycling from 11.0 transitions per day to a median of zero, against an identical untreated twin whose weather-driven improvement was less than half as large in matched bins (measured). Under BAS 0-10 VDC command, a controlled-environment agriculture facility holds a constant vapor-pressure-deficit target across day-night setpoint resets with mean temperature tracking of half a degree (measured and derived), and the published RP-1604 research installation held discharge air within ±1°F on a single-stage compressor in a cleanroom laboratory (published source). Planned additions to this record are the post-correction export from the medical office building, a multi-day multi-room export from the agriculture facility, and instrumentation of a minimum-discharge-air installation.
REFERENCES
[1] Wang, B., Han, L., Shi, W., and Li, X., 2012. “Modulation method of scroll compressor based on suction gas bypass.” Applied Thermal Engineering, Vol. 37, pp. 183–189. doi:10.1016/j.applthermaleng.2011.11.014. Available: https://doi.org/10.1016/j.applthermaleng.2011.11.014
[2] Rawal Devices, Inc. 2020. ASHRAE Research Project (RP-1604) Succeeds with APR-E Valve. Case study, Woburn, MA. Available: https://www.rawal.com/case-study/ashrae-cleanroom-research-project/
[3] ASHRAE. 2018. Active Research Project listing, RP-1604 project abstract. Available: https://www.ashrae.org/File%20Library/Technical%20Resources/Research/WEB-Active-Research-Projects-W17.pdf